
Application logs are awesome.
A user just started backing up their store? Nice! Logger.info.
An error just happened in the system? Boo! Logger.error.
A well-written application-level log can greatly help debug issues and allow you to follow along with what is happening in your system – but it does have limitations. It only contains what you remembered to log. Enabling debug -or trace-level logging- in production will create so much data, but not enabling it can make it harder to identify issues. Alternatively, searching for handwritten log messages can be difficult due to inconsistencies in the wording and format used across the application.
What if you want to maintain a record of every HTTP request your application made, but you want it stored in a separate location and in an easily searchable, consistent format?
This is what we came up with.
The Pieces
ActiveSupport Notifications
The first piece of the puzzle is finding a way for our application to say “Hey! A network operation has occurred!”. There are two conditions:
- We do not want to add code to every method that makes a network request because that would look messy and be redundant.
- We are well aware of our limitations as humans: there is no way we will ever remember to add this code every time we add a new method in the future.
Luckily, we can respect those two conditions quite easily with existing solutions.
The ActiveSupport project has a nifty Notifications module that acts essentially as a Pub/Sub framework. You can “instrument” (ie. publish) events that happen in one part of your code, and other parts of your code can “subscribe” to those events.
Building on that, because we use ActiveResource in a lot of our network operations, we can listen for one event in particular that the ActiveResource framework publishes the moment it sends a request: request.active_resource. The payload for this event includes all the information we require for a useful audit log. All the code you need in order to start processing this event is the following:
ActiveSupport::Notifications.subscribe('request.active_resource') do |*args|
# Ignore events you don’t care about
# Process/Transform the events into a format that makes sense to you
# Write the output to your logging system of choice
end
Kinesis, Lambda and S3
Now that we are able to detect network requests in our application, we need to process and store that data somewhere.
We use Amazon Kinesis Data Streams and AWS Lambda as the backbone for processing our audit log data. Every single time our web application is notified of an ActiveResource request being made that is destructive (creates, updates, & deletes), we write a record of it to our Kinesis stream, making the data available for further asynchronous processing.
We process the data we just stored in Kinesis using a Lambda function. AWS takes care of most of this for us: Lambda natively supports Kinesis triggers so, any time there are 100 new events in the Kinesis stream or a certain period of time has elapsed, Lambda will trigger our function, passing in all of the recent audit log records. We don’t need to write a Kinesis consumer, any retry code, or keep track of the data pointer to the last Kinesis record.
The Lambda function is short and sweet:
- Order the records by account ID and date
- Create a JSON file for every account ID/date combination
- Write the file to an S3 bucket we’ve created for this specific purpose.

If you don’t care about keeping this data in S3 forever, you can choose to configure lifecycle rules to delete it after a certain number of days, or move it to cold storage.
Athena
The final piece of the puzzle: being able to query all that data. This is where Amazon Athena shines. By creating a new Athena table that points to the S3 bucket where all our audit log data is stored, we are able to run specific SQL queries to answer any questions we have about all HTTP requests that our application has made.
The Athena table structure is based on the S3 JSON record which is mapped to a database table as follows:
| operation | code | request_data | response_data | time | identifier | date |
|---|---|---|---|---|---|---|
| put post delete | 200-599 | URL & Body | Body | time | UID | date |
By slicing up the HTTP requests into the above fields we can execute the queries we need to figure out what occurred in the system.
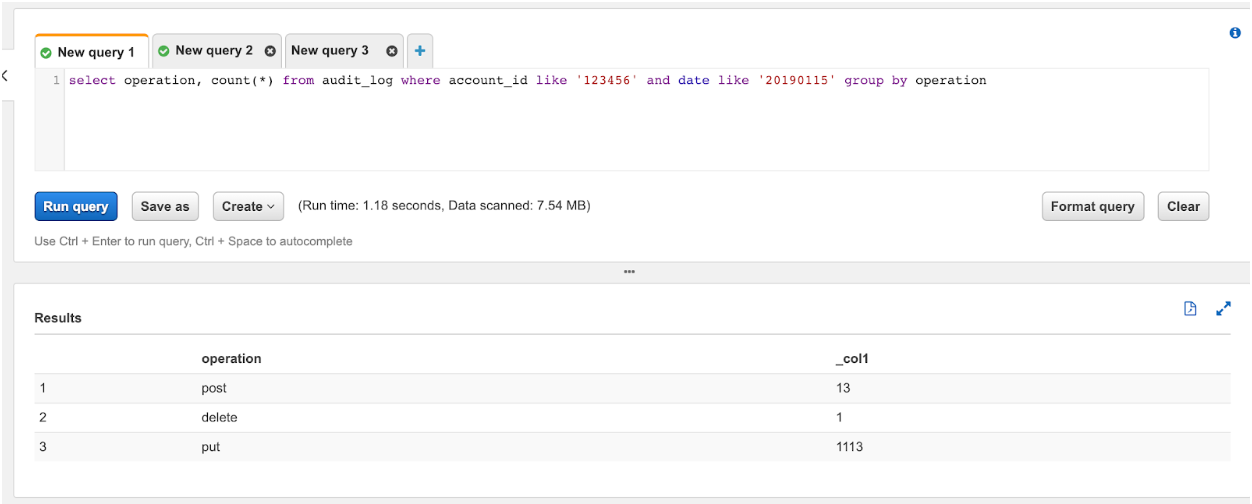
For example like how many requests of each type were made for a particular account on a particular day:
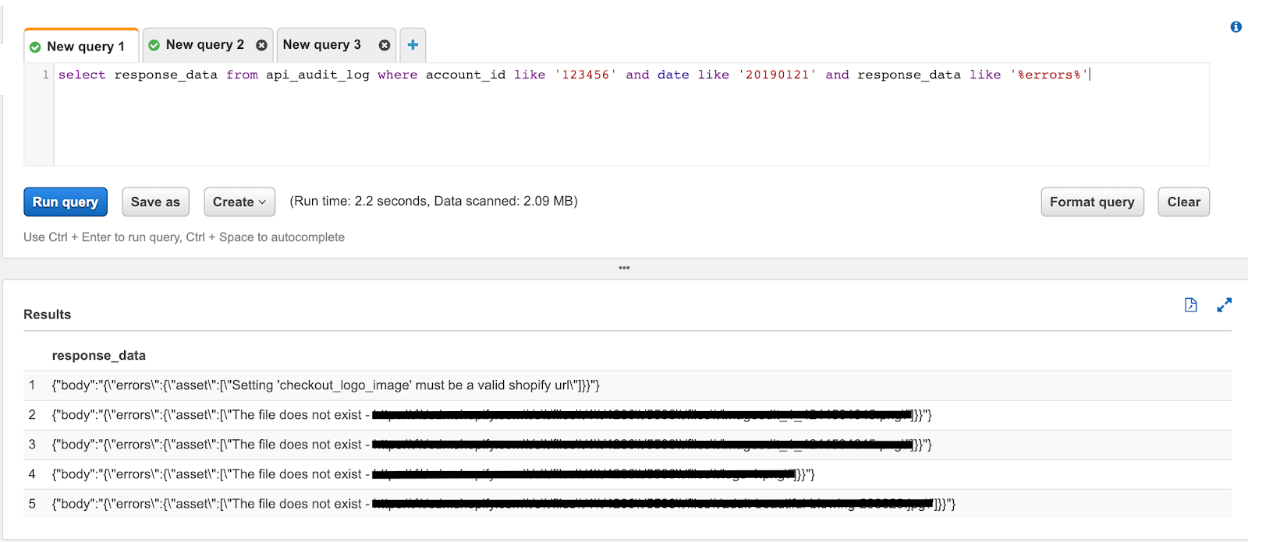
… or something more useful, like digging into a bug that’s been affecting one of our customers:
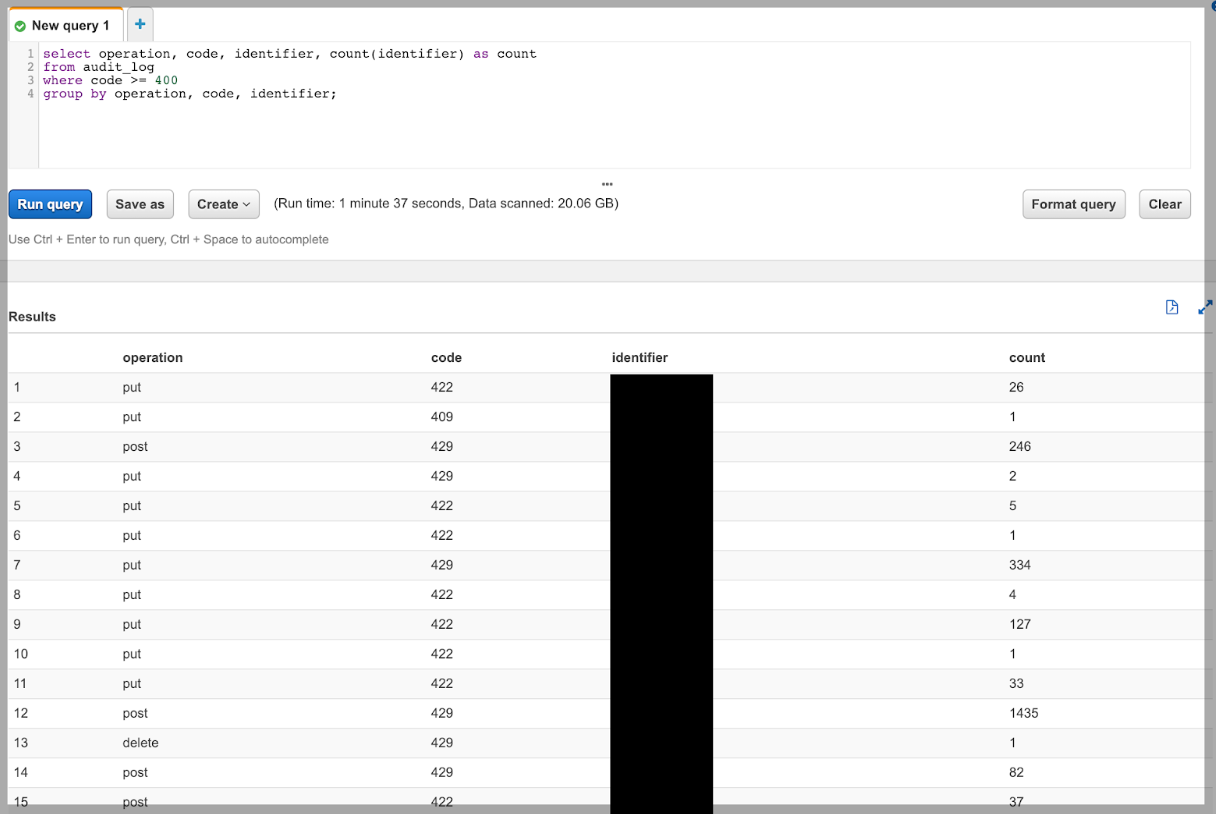
… or even all HTTP error responses for all customers:
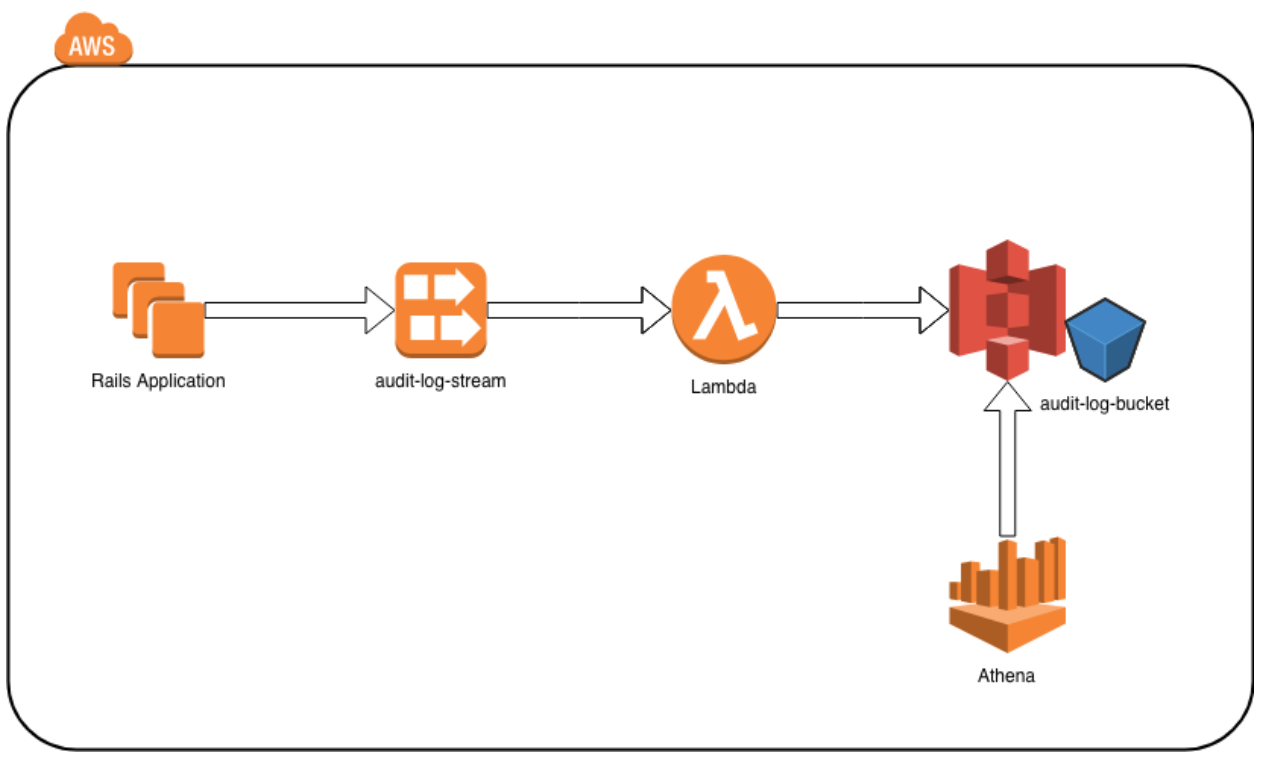
The Big Picture
A diagram of all the pieces we just discussed:
Bonus Points: Auto-Loading Athena Partitions
Athena is billed based on the amount of data scanned, not the amount of data returned. If you have a query that returns only 1 row but has to scan 10TB of data to get that, you are billed on the 10TB of data that had to be scanned. Not to mention the time taken to scan that data which increases the query execution time. To combat this, you can partition the data in an Athena table and create queries that limit results to only particular partitions.
In this use case we have partitioned by account id and date:

In the example queries above, Athena is able to limit its scan to only the specified account_id and date which results in cheaper query cost and faster execution time. But how does Athena know about these partitions in our data?
When a table is defined, you designate which fields to partition on. You can then tell Athena to load these partitions using
MSCK REPAIR TABLE api_audit_log;This will load all partitions into the Athena metastore and the data contained in the partitions can then be queried. The problem with this method is twofold:
- If you forget to run it, you will just silently not get data from any missing partitions
- When you have a lot of partitions, it can take a long time (in our case, over 15 minutes)
Alternatively you can use AWS Glue and a crawler to crawl your data source and look for new partitions to add to Athena. This works well but the minimum frequency a crawler can run is every 5 minutes.
What if there was some way to dynamically add new partitions as they show up in the S3 source data? We created the Athena partition autoloader to do just this.
So how does this work? A Lambda function subscribes to S3 events on the data store (specifically, the object created event) and determines if a new partition is needed in the matching Athena table. If it is, the Lamba issues the ALTER TABLE ADD PARTITION command which takes less than 1 second to execute.
The Lambda is called for every new object that is created in the S3 storage but most of the time, it does not need to add a new partition. We cache the list of partitions in the Lambda execution environment so most operations complete in less than the minimum runtime of 100ms. We estimate it will cost approx $1/month to run this Lambda which is a good value considering we can now get instant results for our auditing queries – and accurate data!
View the source for this solution in Github: https://github.com/rewindio/aws-athena-partition-autoloader
Thanks to Mandeep Khinda for his help on this article.
We’re hiring. Come work with us!
We’re always looking for passionate and talented engineers to join our growing team.
View open career opportunities Marc Morinville">